Interactive Infographics
Take your unique content one step further by layering in live data.
Take your unique content one step further by layering in live data.
Regular content creation can drive exponential growth over time. But it can take a few months to see consistent growth. We offer the creation of larger content pieces, in the form of interactive infographics, to clients who really want to electrify their online marketing results.
Unlike your typical blog or social post, interactive infographics present compelling, personalized data in a completely unique and user-friendly way. Yes, they take longer to make and require more effort. But these in-depth pieces of content are much more likely to be picked up by big publications and drive a huge amount of traffic relatively quickly.
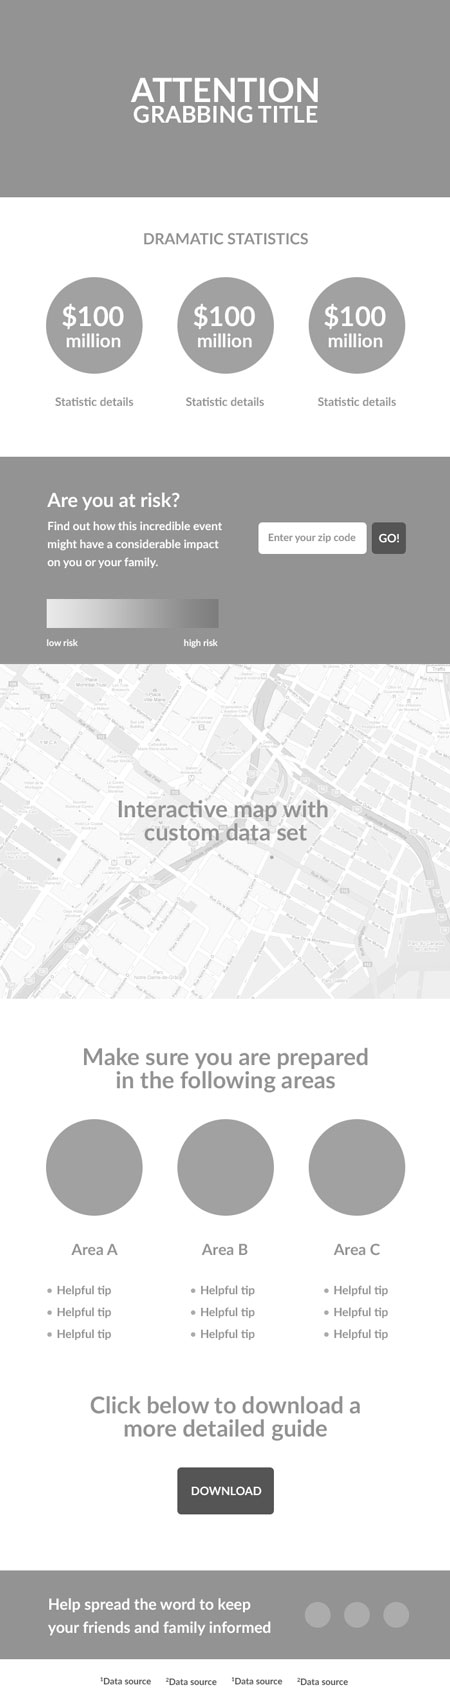
Take a look at the results of an interactive map we built for one client below after just 60 days.
The key to creating a successful interactive infographic is to figure out what information people want to interact with. After all, you could have the coolest-looking map on the planet. But if the map presents information nobody cares about, then they will do just that: not care about it.
Before doing anything else, we tap into our keyword research toolset to discover the latest local, national, or international trends, depending on your target audience. This way, we can create relevant content that is sure to be shared and picked up by iconic publications.
We don’t hit publish once the infographic is fully developed and looking pretty. Instead, we test, test, and test some more. We tap into each segment of our team to review the infographic’s functionality and messaging with their expertise in mind, making sure that all of the data needed for personalized use is in there and that it is displaying properly. Once you and our team agree that the testing we have done is adequate, we will ready the interactive infographic for deployment.
Once we’ve landed on a topic and pinned down source data we can use, it’s time to plan out how we want to present this information. Our content strategist will outline the hierarchy of information we want to show users, working with our designers to present that info in an interactive and intuitive medium.
With the strategy and structure sorted out, we move into development. Since the main focus of the piece will be the information provided, we will establish all of the infographic’s copy first based on its design. Top-level information will be concisely presented first, with more personalized and specific information available as users interact with the piece. We’ll write a 1000+-word article to accompany every interactive infographic. This article will support our link building efforts and will drive organic traffic to the infographic.
When design and copy are approved, we send our developers to work. Our first-class developers have years of experience building out API & data-fed interactive content for a truly interactive experience.
Finally, we will share your interactive infographic on social media with both organic and paid promotion. While in the development stage of the infographic, we build a social media marketing strategy with compelling creatives, strong calls-to-action and targeted audience segments. We will utilize our industry expertise and your knowledge of your audience to create ads that will drive engagement and action.
We help our clients break through the noise of the competition and stand out. It’s not just about ideas, it’s about putting those ideas to the test.